Oct 11, 2009
The ‘Absurd Results’ Doctrine
Wall Street Journal Opinion Journal
’In recent years, many Americans have had cause to wonder whether decisions made at EPA were guided by science and the law, or whether those principles had been trumped by politics,” declared Lisa Jackson in San Francisco last week. The Environmental Protection Agency chief can’t stop kicking the Bush Administration, but the irony is that the Obama EPA is far more “political” than the Bush team ever was.

How else to explain the coordinated release on Wednesday of the EPA’s new rules that make carbon a dangerous pollutant and John Kerry’s cap-and-trade bill? Ms. Jackson is issuing a political ultimatum to business, as well as to Midwestern and rural Democrats: Support the Kerry-Obama climate tax agenda -or we’ll punish your utilities and consumers without your vote.
The EPA has now formally made an “endangerment finding” on CO2, which will impose the command-and-control regulations of the Clean Air Act across the entire economy. Because this law was never written to apply to carbon, the costs will far exceed those of a straight carbon tax or even cap and trade - though judging by the bills Democrats are stitching together, perhaps not by much. In any case, the point of this reckless “endangerment” is to force industry and politicians wary of raising taxes to concede, lest companies have to endure even worse economic and bureaucratic destruction from the EPA.
Ms. Jackson made a show of saying her new rules would only apply to some 10,000 facilities that emit more than 25,000 tons of carbon dioxide each year, as if that were a concession. These are the businesses - utilities, refineries, heavy manufacturers and so forth - that have the most to lose and are therefore most sensitive to political coercion.
The idea is to get Exelon and other utilities to lobby Congress to pass a cap-and-trade bill that gives them compensating emissions allowances that they can sell to offset the cost of the new regulations. White House green czar Carol Browner was explicit on the coercion point last week, telling a forum hosted by the Atlantic Monthly that the EPA move would “obviously encourage the business community to raise their voices in Congress.” In Sicily and parts of New Jersey, they call that an offer you can’t refuse.
Yet one not-so-minor legal problem is that the Clean Air Act’s statutory language states unequivocally that the EPA must regulate any “major source” that emits more than 250 tons of a pollutant annually, not 25,000. The EPA’s Ms. Jackson made up the higher number out of whole cloth because the lower legal threshold - which was intended to cover traditional pollutants, not ubiquitous carbon - would sweep up farms, restaurants, hospitals, schools, churches and other businesses. Sources that would be required to install pricey “best available control technology” would increase to 41,000 per year, up from 300 today, while those subject to the EPA’s construction permitting would jump to 6.1 million from 14,000.
That’s not our calculation. It comes from the EPA itself, which also calls it “an unprecedented increase” that would harm “an extraordinarily large number of sources.” The agency goes on to predict years of delay and bureaucratic backlog that “would impede economic growth by precluding any type of source -whether it emits GHGs or not - from constructing or modifying for years after its business plan contemplates.” We pointed this out earlier this year, only to have Ms. Jackson and the anticarbon lobby deny it.
Usually it takes an act of Congress to change an act of Congress, but Team Obama isn’t about to let democratic—or even Democratic—consent interfere with its carbon extortion racket. To avoid the political firestorm of regulating the neighborhood coffee shop, the EPA is justifying its invented rule on the basis of what it calls the “absurd results” doctrine. That’s not a bad moniker for this whole exercise.
The EPA admits that it is “departing from the literal application of statutory provisions.” But it says the courts will accept its revision because literal application will produce results that are “so illogical or contrary to sensible policy as to be beyond anything that Congress could reasonably have intended.”
Well, well. Shouldn’t the same “absurd results” theory pertain to shoehorning carbon into rules that were written in the 1970s and whose primary drafter -Michigan Democrat John Dingell - says were never intended to apply? Just asking. Either way, this will be a feeble legal excuse when the greens sue to claim that the EPA’s limits are inadequate, in order to punish whatever carbon-heavy business they’re campaigning against that week.
Obviously President Obama is hellbent on punishing carbon use - no matter how costly or illogical. And of course, there’s no politics involved, none at all. See post here.
Oct 09, 2009
What happened to global warming?
By Paul Hudson, BBC Climate Correspondent
This headline may come as a bit of a surprise, so too might that fact that the warmest year recorded globally was not in 2008 or 2007, but in 1998. But it is true. For the last 11 years we have not observed any increase in global temperatures.
And our climate models did not forecast it, even though man-made carbon dioxide, the gas thought to be responsible for warming our planet, has continued to rise. So what on Earth is going on?
Climate change sceptics, who passionately and consistently argue that man’s influence on our climate is overstated, say they saw it coming. They argue that there are natural cycles, over which we have no control, that dictate how warm the planet is. But what is the evidence for this? During the last few decades of the 20th century, our planet did warm quickly.
Recent research has ruled out solar influences on temperature increases
Sceptics argue that the warming we observed was down to the energy from the Sun increasing. After all 98% of the Earth’s warmth comes from the Sun.
But research conducted two years ago, and published by the Royal Society, seemed to rule out solar influences. The scientists’ main approach was simple: to look at solar output and cosmic ray intensity over the last 30-40 years, and compare those trends with the graph for global average surface temperature. And the results were clear. “Warming in the last 20 to 40 years can’t have been caused by solar activity,” said Dr Piers Forster from Leeds University, a leading contributor to this year’s Intergovernmental Panel on Climate Change (IPCC).
But one solar scientist Piers Corbyn from Weatheraction, a company specialising in long range weather forecasting, disagrees. He claims that solar charged particles impact us far more than is currently accepted, so much so he says that they are almost entirely responsible for what happens to global temperatures. He is so excited by what he has discovered that he plans to tell the international scientific community at a conference in London at the end of the month. If proved correct, this could revolutionise the whole subject.
Ocean cycles
What is really interesting at the moment is what is happening to our oceans. They are the Earth’s great heat stores. In the last few years [the Pacific Ocean] has been losing its warmth and has recently started to cool down. According to research conducted by Professor Don Easterbrook from Western Washington University last November, the oceans and global temperatures are correlated. The oceans, he says, have a cycle in which they warm and cool cyclically. The most important one is the Pacific decadal oscillation (PDO). For much of the 1980s and 1990s, it was in a positive cycle, that means warmer than average. And observations have revealed that global temperatures were warm too. But in the last few years it has been losing its warmth and has recently started to cool down. These cycles in the past have lasted for nearly 30 years.
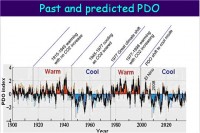
So could global temperatures follow? The global cooling from 1945 to 1977 coincided with one of these cold Pacific cycles. Professor Easterbrook says: “The PDO cool mode has replaced the warm mode in the Pacific Ocean, virtually assuring us of about 30 years of global cooling.” So what does it all mean? Climate change sceptics argue that this is evidence that they have been right all along. They say there are so many other natural causes for warming and cooling, that even if man is warming the planet, it is a small part compared with nature.
But those scientists who are equally passionate about man’s influence on global warming argue that their science is solid. The UK Met Office’s Hadley Centre, responsible for future climate predictions, says it incorporates solar variation and ocean cycles into its climate models, and that they are nothing new. In fact, the centre says they are just two of the whole host of known factors things that influence global temperatures - all of which are accounted for by its models. In addition, say Met Office scientists, temperatures have never increased in a straight line, and there will always be periods of slower warming, or even temporary cooling. What is crucial, they say, is the long-term trend in global temperatures. And that, according to the Met office data, is clearly up.
To confuse the issue even further, last month Mojib Latif, a member of the IPCC (Intergovernmental Panel on Climate Change) says that we may indeed be in a period of cooling worldwide temperatures that could last another 10-20 years.
The UK Met Office says that warming is set to resume
Professor Latif is based at the Leibniz Institute of Marine Sciences at Kiel University in Germany and is one of the world’s top climate modellers. But he makes it clear that he has not become a sceptic; he believes that this cooling will be temporary, before the overwhelming force of man-made global warming reasserts itself.
So what can we expect in the next few years? Both sides have very different forecasts. The Met Office says that warming is set to resume quickly and strongly. It predicts that from 2010 to 2015 at least half the years will be hotter than the current hottest year on record (1998). Sceptics disagree. They insist it is unlikely that temperatures will reach the dizzy heights of 1998 until 2030 at the earliest. It is possible, they say, that because of ocean and solar cycles a period of global cooling is more likely. One thing is for sure. It seems the debate about what is causing global warming is far from over. Indeed some would say its hotting up. Read post here.
Oct 07, 2009
Not ‘Evil,’ just ‘Stupid’
By Peter Foster, National Post
The film Not Evil Just Wrong is far too politically incorrect to be feted in Hollywood or the politicos. This is the last movie they want anybody seeing.
Irish filmmaker Phelim McAleer pulled a Michael Moore at the recent New York “eco-premiere” of the environmental disaster movie The Age of Stupid. The film suggests that flying is one of the worst things you can do to the planet, so Mr. McAleer, microphone in hand, started asking those coming down the recycled green carpet how they’d travelled to the Big Show. Gillian Anderson, of X-Files fame, pronounced, “you know sometimes, sometimes people have to fly to make a stand in order to get peoples’ attention for these issues.” The film’s director, Franny Armstrong, evaded the question and claimed that the film had only generated the emissions of four average Americans over a year. Mr. McAleer persisted and soon found himself hustled outside the green velvet rope, insisting “I only want to ask celebrities difficult questions.”
Some hope.
Mr. McAleer was trying to drum up a little publicity for his own, very different, film, Not Evil Just Wrong, which has its world premiere on October 18. Only it won’t be at the World Financial Center. It will take place in homes, on campuses, and at privately-organized screenings across North America. (You can be part of the event by ordering a package complete with DVD, poster, and swatch of red carpet from www.noteviljustwrong.com.)
Mr. McAleer and his wife Ann McElhinney - who also made Mine Your Own Business, a documentary that fingered anti-development radicals and “the dark side of environmentalism” - have inevitably not attracted the kind of attention lavished on The Age of Stupid (ICECAP NOTE: a term which aptly describes collectively the UN, politicians, the alarmists, environmentalists, hollywood and media supporters), which features a lone archivist looking back from a devastated world in the year 2055 and wondering how we could have allowed it all to go so terribly, terribly wrong. (ICECAP NOTE: more likely that the world followed the UN and company down their path to global governance/destruction)
It is surely worth noting that those who claim that there is “consensus” on global warming science being “settled” seem to imagine that this gives them licence to then compete with each other in producing eco-porn that goes far beyond anything in the very worst scenarios peddled by the UN’s Intergovernmental Panel on Climate Change. Shouldn’t warmists stick to the script before they roll the carbon credits?
Not Evil Just Wrong in fact has a field day with apocalyptic science, particularly that peddled by Al Gore and his pet boffins. NASA’s James Hansen almost convulses onscreen at the mention of Canadian independent researcher Stephen McIntyre, the man who broke the IPCC’s iconic “hockey stick” temperature graph, and continues to hold alarmists to the highest standards. Meanwhile another of Mr. Gore’s gurus provides a parallel to Mr. McAleer’s being escorted off Stupid’s green carpet. The Not Evil team went to Stanford University to interview climatologist Stephen Schneider. It was apparently inconceivable to Professor Schneider that anybody in the film community could be anything other than a full warmist, so imagine his surprise when Messrs. McAleer and McElhinney were impolite enough to point out that in the 1970s he had been one of the leading proponents of catastrophic global cooling! Clearly Professor Schneider didn’t want his image attached to any such inconvenient recollections, so Stanford University’s lawyers withdrew permission for any shots of either the good professor or the campus to be shown.
Not Evil Just Wrong is far too politically incorrect to be feted in Hollywood, or welcomed by political elites. This is the last movie that those squabbling down the road to Copenhagen want anybody seeing or thinking about. That’s why it needs maximum exposure on October 18.
What is truly frightening is the slavish adulation that film makers such as Ms. Armstrong receive. While claiming to be “indie” and low-budget, and grassroots “crowd-funded,” Ms. Armstrong has the vast clout of environmental organizations such as Greenpeace and Friends of the Earth behind her, as well as billionaire George Soros’s Moveon.org. The New York premiere was beamed to numerous locations around the world. In Nigeria, the Governor of Lagos was an attendee. In Amsterdam and Copenhagen, membes of the Dutch and Danish Royal Families turned out. The New York premiere was followed by a question and answer session featuring Kofi Annan, former secretary general of the United nations, and Mary Robinson, a former president of Ireland and past head of the UN’s Human Rights Commission.
Stupid meanwhile had already been screened for “the United Nations, Center of American Progress, EPA, The World Bank, the UK Parliament, the European Union, and the Scottish, Welsh, Swedish, Australian and Dutch parliaments.”
The film’s London premiere early this year was attended by a bevy of politicos, including the Labour government’s Environment Minister, Ed Miliband, who was promptly ambushed by the film’s star, Pete Postlethwaite, over new coal plants. Mr. Postlethwaite threatened to hand back his Order of the British Empire if they weren’t stopped! That must have sent a shudder through Buckingham Palace.
Being a bit of calculated masochist, Mr. Miliband then agreed to debate Ms. Armstrong, whereupon she used the occasion to launch a “10 by 10” campaign, to cut carbon emissions by 10% by the end of 2010. Soon not only Mr. Miliband but Prime Minister Gordon Brown and the entire cabinet had signed on, plus the shadow cabinet, along with a raft of major corporations, municipalities, soccer clubs and other publicity seekers.
Messrs McAleer and McElhinney meanwhile have received death threats, been described as “stinking, selfish, sociopathic fascists,” and received wishes that their children be born handicapped. That’s what you get for asking “difficult questions.” Read more here.
Icecap Note: The elitists trecking to see the Age of Stupid are mostly not stupid, just ignorant and they are desperate to find just enough material to keep them that way. One Columbia professor expressed great frustration that nature was not cooperating with their forecast cataclysmic view of the future. If you can get some of them to see Not Evil Just Wrong, their eyes may be opened, if they allow their minds to be opened. I have seen an earlier version of NEJW and it is worth your time to see the hypocrisy of the environmenal extremists and Al Gore, to see James Hansen speechless and what the environmental agenda may do to the hard working people of this great country and other countries, large and small, of the world.
UPDATE: Apparently according to Paul Chesser, Heartland Institute Correspondent on an October 9th post, Phelim McAleer, co-director/producer of “Not Evil Just Wrong” and asker of difficult questions, reportedly just had his microphone turned off as he queried Al Gore at the Society of Environmental Journalists conference in Madison, Wisconsin. At the Society of Environmental Journalists conference today, he says pulling just one thread will solve three crises: climate, national security and the economy.
Oct 06, 2009
Stanford U. Bans Skeptical Climate Film from Airing Interview with Professor Stephen Schneider
By Marc Morano, Climate Depot
Climate Depot Exclusive
Stanford University has banned a skeptical documentary film from airing a climate change interview with one of its prominent warming activist professors, Stephen Schneider. After legal threats from Stanford University—apparently on behalf of Prof. Schneider—the documentary filmmakers were forced to use a blank screen and an actor had to read the transcript of Schneider’s already taped but legally banned climate interview. The skeptical global warming documentary ”Not Evil Just Wrong”, set for its international premier on October 18, 2009, interviewed Schneider about his flip-flop from a coming ice age proponent in the 1970s to his current advocacy of man-made global warming fears. Schneider is a professor of biological sciences at Stanford University. (email: shswebsite@lists.stanford.edu)
Irish filmmaker Phelim McAleer told Climate Depot: “Lawyers for Stanford University have tried to ban our documentary from reporting on how one of their professors previously predicted an imminent ice-age, but is now a leading global warming advocate.” (Schneider joins others like Obama Science Czar John Holdren. See: Climate Depot’s Factsheet on 1970s Coming ‘Ice Age’ Claims —‘Fears of a coming ice age, showed up in peer-reviewed literature, at scientific conferences, by prominent scientists and throughout the media’
To watch the “banned” video excerpt from “Not Evil Just Wrong” of an actor portraying Schneider’s interview click here.
Climate Depot has obtained a copy of Stanford University’s legal letter prohibiting the Irish filmmakers from airing Schneider’s already taped interview in which he was questioned about his inconvenient conversion from a global cooling advocate in the 1970s to a present day global warming activist.
‘You are prohibited’
Stanford University sent a scathing letter to the documentary makers declaring: “You are prohibited from using any of the Stanford footage you shot, including your interview of Professor Stephen Schneider. Professor Schneider likewise has requested that I inform you that he has withdrawn any permission for you to use his name, likeness or interview in connection with any film project you may undertake.”
‘Removed from your footage’
The Stanford letter concluded: “Please confirm to me in writing that you have received and will comply with Stanford’s directive that all shots of Stanford University (both indoors and outdoors) and all parts of Professor Schneider’s interview will be removed from your footage. We appreciate your prompt attention to this matter.”
Climate Depot has also obtained the exclusive pre-release video and the transcript of Schneider’s interview which Stanford University lawyers deemed too hot for broadcast. McAleer called on Stanford to withdraw the legal threat which has forced the filmmakers to use a blank screen and an actor’s voice to read the text of Professor Schneider’s interview about his changing climate positions.
“The lawyers at Stanford sent the unprecedented letter after we asked Schneider about his flip-flopping on climate alarmism,” the film’s director McAleer explained. McAleer said he is shocked at the legal maneuvering by Stanford to censor an interview with one of their most prominent professors.
‘Chilling effect’
“This will have a chilling effect on academic freedom and students. It sends out the message - don’t ask your professors embarrassing questions because they will not be tolerated,” McAleer said.
McAleer’s documentary “Not Evil Just Wrong” takes a skeptical look at man-made global warming claims. “Not Evil Just Wrong” attempts to “show the human cost of extreme environmentalism.” “It reveals how global warming legislation such as cap-and-trade will chase jobs out of America during one of the biggest recessions in living memory,” McAleer said.
To watch the “banned” video excerpt from “Not Evil Just Wrong” of Schneider’s interview click here.
‘Sufficient to trigger an ice age’
In the 1970s Professor Schneider was one of the leading voices warning the Earth was going to experience a catastrophic man-made ice-age. However he is now a member of the UN IPCC and is a leading advocate warning that the Earth is facing catastrophic global warming. In 1971, Schneider co-authored a paper warning of the possibility of a man-made “ice age.” See: Rasool S., & Schneider S."Atmospheric Carbon Dioxide and Aerosols - Effects of Large Increases on Global Climate”, Science, vol.173, 9 July 1971, p.138-141 - Excerpt: “The rate of temperature decrease is augmented with increasing aerosol content. An increase by only a factor of 4 in global aerosol background concentration may be sufficient to reduce the surface temperature by as much as 3.5 deg. K. If sustained over a period of several years, such a temperature decrease over the whole globe is believed to be sufficient to trigger an ice age.”
Schneider was still promoting the coming “ice age” in 1978. (See: Unearthed 1970’s video: Global warming activist Stephen Schneider caught on 1978 TV show ‘In Search Of...The Coming Ice Age’ - September 20, 2009) By the 1980’s, Schneider reversed himself and began touting man-made global warming. See: “The rate of [global warming] change is so fast that I don’t hesitate to call it potentially catastrophic for ecosystems,” Schneider said on UK TV in 1990.
‘Scary scenarios’
Schneider also has made controversial remarks advocating “scary scenarios” to convince the public of climate threat. “So we have to offer up scary scenarios, make simplified, dramatic statements, and make little mention of any doubts we might have.” (For full context of Schneider’s quote see here.)
‘Slaughter’ skeptics in a debate?
Schneider also reversed himself after issuing a public debate challenge to skeptical scientists in 2009. Schneider originally boasted that skeptics would be “slaughtered” in a debate, but after numerous challengers stepped forward, he quickly backed off and declared he would not ”schedule some political show debate.” See: Scientist who boasted he could ‘slaughter’ skeptics in debate backs off...’I certainly will not schedule some political show debate in front of a non-scientific audience ‘ - June 1, 2009
1970s ‘Ice Age’ Fears Were Widespread
Despite many claims to the contrary, the 1970’s global cooling fears appeared in peer-reviewed literature, scientific conferences and were widespread among many scientists and in the media. Newsweek Magazine even used the climate “tipping point” argument in 1975 to hype global cooling. Newsweek wrote April 28, 1975 article: “The longer the planners delay, the more difficult will they find it to cope with climatic change once the results become grim reality.”
But on October 24, 2006, Newsweek admitted it erred in predicting a coming ice age in the 1970’s. (See also: NYT: Obama’s global warming promoting science czar Holdren ‘warned of a coming ice age’ in 1971 - September 29, 2009 & also see: NASA warned of human caused coming ‘ice age’ in 1971 - Washington Times - September 19, 2007 and also see: 1975 New York Times: “Scientists Ask Why World Climate is Changing, Major Cooling May Be Ahead”, May 21, 1975 and see: 1974 Time Magazine: “Another Ice Age,” June 24, 1974)
For a full report on the 1970’s ice age scare, see Climate Depot’s 1970’s Ice Age Fact Sheet. Climate Depot’s Factsheet on 1970s Coming ‘Ice Age’ Claims --’Fears of a coming ice age, showed up in peer-reviewed literature, at scientific conferences, by prominent scientists and throughout the media’
Oct 06, 2009
United Nations Pulls Hockey Stick from Climate Report
By Anthony Watts
WUWT (and ICECAP) readers may recall that Steve McIntyre’s Climate Audit blog discovery of UNEP’s use of a Wikipedia “hockey Stick” graphic by “Hanno”, was the subject of last week’s blog postings.
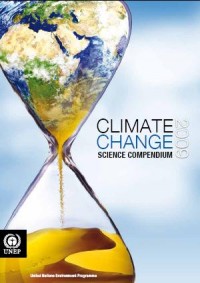
The Yamal data hockey stick controversy overshadowed it, and much of the focus has been there recently. The discovery of a Wikipedia graphic in the UNEP Climate Change Science Compendium must have been embarrassing as it shows the sort of sloppy science that is going into “official” publications.
In this case, the United Nations simply grabbed an image from Wikipedia that supported the view they wanted to sell. The problem with the graph in the upper right of page 5 of the UNEP report is that it itself has not been peer reviewed nor has it originated from a peer reviewed publication, having its inception at Wikipedia. And then there’s the problem of the citation as “Hanno 2009” who (up until this story broke) was an anonymous Wikipedia contributor.
Yet UNEP cited the graph as if it was a published and peer reviewed work as “Hanno 2009”. In this case, the United Nations simply grabbed an image from Wikipedia that supported the view they wanted to sell.
The hockey stick, based on tree ring proxies has met an inconveniently timed death it seems. It appears now that somebody at the United Nations must have gotten the message from blogland, becuase there has been a change in the graphics on page 5. Below is page 5 (enlarged here) as it appears in the UNEP Climate Change Science Compendium today:
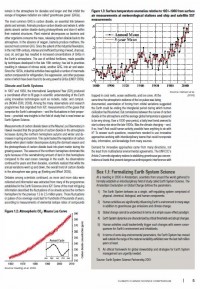
It’s gone. It has been replaced with the familiar GISS land-ocean record, not quite a hickey stick, but close enough. You can see the GISS graph from the GISTEMP web page right here, oddly the UN used the 2005 version (citing Hansen et al 2005) rather than the 2009 version of the graph, seen below. Might it be that pesky downturn at the end of the graph? Or maybe they are just Google challenged?
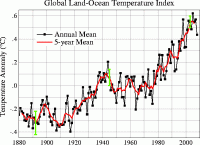
It sure would be nice if such publications could display animated GIFS, for example this one showing two different vintages of GISS data:
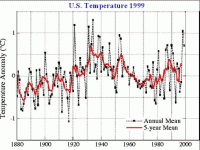
Go here if not animating.
Maybe climate blogs can convince the UN to change their graph yet again. Thanks to sharp eyed WUWT reader Lawrie (of Sydney Australia) for pointing out the change made to the UNEP document.
|


